Graphs
Requirements
- Everything learned from Numbers and number systems
Delving into graphs…
Firstly, the “2D graph world” (known as the cartesian plane) has an x and a y axis with each coordinate fitting into 4 differen’t boxes (quadrants). Each dot is given a 2 digit reference in the form:
$$ (x, y) $$
If we have a line and are given the end co-ordinates for the start and the end of the line:
$$ (x_1, y_1), (x_2, y_2) $$
we can calculate the mid point through this formula:
$$ (\dfrac{x_1 + x_2}{2}, \dfrac{y_1 + y_2}{2}) $$
A straight line graph follows this general form:
$$ y = mx + c $$
where m is the gradient (the “steepness” of the line) and c is the value of the line when it crosses the y axis (the y-intercept). Let’s show an example:
$$ y = 5x + 7 $$
It’s important to mention that along the y axis, x is equal to 0 and on the x axis, y is equal to 0.
There are 2 ways to find the gradient of a line. Here is the formula that we use:
$$ m = \dfrac{\Delta y}{\Delta x} = \dfrac{y_2 - y_1}{x_2 - x_1} $$
We can either make a triangle between 2 points and calculate the gradient using the formula, or we can select 2 coordinates and use the formula without drawing a triangle:
Plotting linear equations is very easy, all we need to do is draw a table of values for y and for x, then we can plot these coordinates on a graph, and with a ruler draw a straight line through all of them. Let’s try and plot:
$$ y = 3x + 1 $$
We can plot our table of values by substituting the number for the letter. For example:
$$ y = 3(\color{red}{-3}) + 1 = -8$$
| $$ x $$ | $$ y $$ |
|---|---|
| $$-3$$ | $$-8$$ |
| $$0$$ | $$1$$ |
| $$3$$ | $$10$$ |
We now need to learn how to draw parabola curves (which is what quadratic equations make). Parabolas either look like a sad face (if they have a negative gradient) or a happy face if they have a positive gradient. In order to plot a parabola we need to complete the square. Let’s complete the square for the following graph equation:
$$ y = 2x^2 + 3x + 4 \Rightarrow a(x + \dfrac{b}{2a})^2 + (c - \dfrac{b^2}{4a}) $$ $$ y = 2(x + \dfrac{3}{2(2)})^2 + (4 - \dfrac{3^2}{4(2)}) $$ $$ y = 2(\color{blue}{x} + \dfrac{3}{4})^2 + \color{red}{2.875} $$ $$ \therefore \text{Turning point:} (\color{blue}{-\dfrac{3}{4}}, \color{red}{2.875}) $$
Through the turning point, their is a line of symmetry so that one side looks the same as the other side.
For any graph you are plotting you should always make a table of values, for cubics and quadratics this should be a much larger table of values than for linear equations.
Next, we need know how to draw sin, cos and tan graphs. Sin, cos and tan are infinitely repeating graph patterns that will be used later on for trigonometry.
Sin is a wave shape which oscillates (repeats identically) from 1 to -1 on the y axis. You can plot the sin (pronounced sine) wave easily by drawing points every 90 degrees.
Cosine also follows the same pattern. The difference is that at the origin, cosine is (0,1) whilst sine is (0,0). So cosine is 90 degrees less than sine.
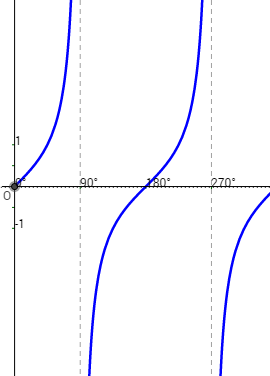
Tan is a completely different looking pattern.
We also need to be able to understand what happens to these graphs when we apply certain transformations.
We can find the gradient of a non-linear graph (a graph that isn’t straight) by drawing a straight line that passes across the curve at a single point, and calculating the gradient for that straight line (called a tangent) will give us the gradient of the curved line at that point. Note that the gradient of a curve changes whilst the gradient of a straight line doesn’t.
We can find the intersection of 2 linear graphs or 1 linear, 1 non-linear by solving them as simultaneous equations.
Parallel lines have the same gradient.
Perpendicular lines have a gradient equal to:
$$ \dfrac{-1}{m} $$
Where m is the gradient of the straight line.
Further reading
More coming soon
Home - Maths Portal
This work is licensed under a Creative Commons Attribution-NoDerivatives 4.0 International License..